Section 1 | Introduction to Air Quality Targets
Current Air Quality Targets
This table shows the World Health Organisation (WHO) 2005 and updated 2021 guideline levels. Concentrations are in μg m-3.
1.2m people or circa. 40% of the West Midlands’ population live in wards exceeding the 2005 WHO PM target of 10 μg m-3.
DEFRA mapping data indicates that ward average annual mean PM2.5 levels in 72 of the 192 wards within the West Midlands exceed 10µg/m-3.
| Pollutant |
Average time |
World Health Organisation Guidelines 2005 |
World Health Organisation Guidelines 2005 |
| Fine Particles PM2.5 |
Annual mean |
10 |
5 |
| Fine Particles PM10 |
Annual mean |
20 |
15 |
| Nitrogen Dioxide NO2 |
Annual mean |
40 |
10 |
| Ozone O3 |
Daily max 8h mean |
100 |
100 |
Source: Selected current Air Quality Objectives for England, and WHO 2005 and updated 2021 guideline levels. Concentrations in μg m-3
UK Air Quality Targets
These are the national air quality objectives, which are set by UK government and have been shaped by the WHO guidelines. However, the UK objectives are still higher than the 2021 guidelines recommended by WHO.
The Environmental Targets (Fine Particulate Matter) (England) Regulations 2023 set a new annual mean concentration target and population exposure reduction target for PM2.5 to be achieved by the end of 2040, in accordance with the Environment Act 2021. A non-statutory interim target has also been set for 2028. The relevant Air Quality Standards as objectives, limit values and targets are shown on the right.
NO2
| Government Objective in England (µg/m-3) |
Averaging Period |
| 40, as the limit value not to be exceeded |
Annual mean |
| 200, not to be exceeded more than 18 times a year |
1-hour (hourly) mean |
PM10
| Government Objective in England (µg/m-3) |
Averaging Period |
| 40, as the limit value not to be exceeded |
Annual mean |
| 50, not to be exceeded more than 35 times a year |
24-hour (daily) mean |
PM2.5
| Government Objective in England (µg/m-3) |
Averaging Period |
| 20, as the limit value not to be exceeded |
Annual mean |
| 12, as an interim target concentration not to be exceeded by the end of January 2028 |
Annual mean |
| 10, as a target concentration not to be exceeded by the end of 2040 |
Annual mean |
UK Air Quality Targets
The Environment Improvement Plan 2023 details the government’s plan to work with landowners, communities and businesses to deliver goals for improving the environment, matched with interim targets to measure progress.
Commitment 01
A legal target to reduce population exposure to PM2.5 by 35% in 2040 compared to 2018 levels, with a new interim target to reduce by 22% by the end of January 2028.
Commitment 02
Legal concentration limits for several other key pollutants. Most of these limits have already been met, e.g. for sulphur dioxide and coarse particulate matter. The government is working towards meeting compliance with a 40µg/m-3 limit for nitrogen dioxide.
Commitment 03
A legal target to require a maximum annual mean concentration of 10 micrograms of PM2.5 per cubic metre (µg/m-3) by 2040, with a new interim target of 12µg/m-3 by the end of January 2028.
Commitment 04
Legal emission reduction targets for five damaging pollutants by 2030 relative to 2005 levels:
- Reduce emissions of nitrogen oxides by 73%.
- Reduce emissions of sulphur dioxide by 88%.
- Reduce emission of PM2.5 by 46%.
- Reduce emissions of ammonia by 16%.
- Reduce emissions of non-methane volatile organic compounds by 39%.
How is air quality regulated?
Air quality is regulated at a national and local government level. Firstly, we will look at national Acts and then we will cover local air quality action plans and strategies.
Environment Act 1995
Local authorities must review and document local air quality within their area by way of staged appraisals and respond accordingly, with the aim of meeting the air quality objectives.
Where objectives are not likely to be achieved, an authority is required to designate an Air Quality Management Area (AQMA).
For each AQMA, the local authority is required to draw up an Air Quality Action Plan (AQAP) to secure improvements in air quality and show how it intends to work towards achieving air quality standards in the future.
Councils are legally bound to produce an annual status report on whether health-based air quality objectives have been achieved and how they are monitoring air pollution.
Environment Act 2021
This sets a legally binding duty on the Secretary of State to bring forward Air Quality Targets into secondary legislation; with specific regard to the annual mean level of PM2.5 in ambient air.
Current Air Quality Targets
In the UK, responsibility for meeting air quality limit values is devolved to the national administrations.
In England, there are additional regulations relating to the air pollutant of most harm to health - fine particulate matter (PM2.5). The Environmental Targets (fine particulate matter) (England) Regulations 2023 set two PM2.5 targets to be met by 2040, these require that:
- The annual mean concentration is 10 µg m-3 or lower.
- That the population exposure is reduced by 35% compared to 2018 levels.
The two targets are designed to work together to drive actions that both reduce concentrations where it is highest and reduce the pollution that everyone in the country experiences.
What are we doing locally?
Each constituent local authority within the WMCA (other than Solihull who has a separate air quality strategy) need to produce an AQAP detailing how they plan to work towards achieving the Air Quality Targets set by the government.
Wolverhampton City Council’s Air Quality Action Plan (2006)
addresses the reduction of emissions from transport, industry and commerce, improving public transport and active travel options as well as reducing emissions and traffic volumes, and infrastructure improvements.
Walsall Council’s Air Quality Action Plan (2009)
addresses the need to reduce vehicle emissions and traffic, as well as promote public transport and active travel. It also looks to address both road and rail infrastructure.
Sandwell MBC Air Quality Action Plan (2020 - 2025)
focuses on a number of transport measures to improve air quality, as well as exploring the role of planning and behaviour change campaigns. It highlights the need for the local authority to lead by example.
Dudley MBC Air Quality Plan (2011)
includes the following approaches to tackling air quality: behaviour change, addressing school travel, improvement of public transport, leading by example with the council’s fleet and building air quality into planning.
Birmingham City Council/Brum Breathes Clean Air Strategy - Birmingham’s Journey to Clean Air 2022
includes eight key actions to improve air quality, which include behaviour change, access to data and reducing specific emissions from non-road mobile machinery.
Birmingham City Council Air Quality Action Plan (2021 - 2026)
includes the implementation of the Clean Air Zone and other mitigation measures, as well as exploring the impact of transport and demand reduction. There is also some work on controlling industrial and domestic emissions and behaviour change.
Solihull MBC Clean Air Strategy (2019 - 2024)
focuses on a range of different behaviour change and transport interventions, including schools’ programmes, electrification of transport, provision of infrastructure for electric vehicles and modal shift. Solihull’s plan is different from the other local authorities as the only constituent authority not mandated (by Defra) to produce an AQAP.
Coventry City Council Local Air Quality Plan (approved by the government in 2020)
is focused on transport and behaviour change around travel, including promoting EVs, decarbonising the public transport network, real-time air quality monitoring linked to dynamic traffic management, improvements to the road network to tackle congestion, construction of segregated cycle routes and initiatives supporting behaviour change and active travel.
Smoke Control Areas (SCAs)
SCAs are one of the legally enforceable measures for regulating air quality.
It is a criminal offence to emit smoke from a chimney of a building or moored vessel in an SCA and you can only burn authorised fuel, unless you use an appliance approved by Defra.
In these areas, people and businesses must not emit a substantial amount of smoke from a chimney. People also must not buy or sell unauthorised fuel for use in an SCA unless it is used in an exempt appliance (appliances which are approved for use in SCAs).
To find out which areas of England are designated SCAs, please visit the Smoke Control Area map.
Failure to comply can result in fines, which are up to £300 for releasing smoke through a chimney in an SCA in England and up to £1,000 for buying unauthorised fuel to use in a non-Defra-approved appliance in an SCA.
Sandwell, Solihull, Walsall, Wolverhampton, Birmingham and Coventry are all designated SCAs.
People living in an SCA are only allowed to burn authorised fuels in an open fire or an exempt appliance, such as certain wood-burning stoves. The government sets Ready to Burn wood or smokeless fuels, such as gas, anthracite and low volatile steam coal, as authorised fuels. Dry, Ready to Burn wood/logs and briquettes make any appliance more efficient and are better for the environment.
Will net zero policies solve air pollution?
We might think that as the UK works towards achieving net zero by 2050 (cutting greenhouse gas emissions to as close to zero as possible, to reduce the impacts of climate change) such as by switching to electric cars, will solve our air pollution problem.
However, unfortunately, this is not the case. The transition to electric vehicles will reduce tailpipe NO2 emissions (which dominate in the West Midlands); however, these will not see a significant reduction in PM for two main reasons.
- In part, because vehicle emissions of PM arise from both the exhaust and non-exhaust sources (notably brakes and tyres).
- PM is also emitted from a broad range of sources so changes to the vehicle fleet have a smaller impact on total emissions.
You can see these two main reasons reflected in the graph below.
Direct (primary) national total emissions of NO2 and PM2.5 for 2016, and projections (without additional interventions) for 2020 and 2030, from the Clean Air Strategy (2019).
Source: WM options paper
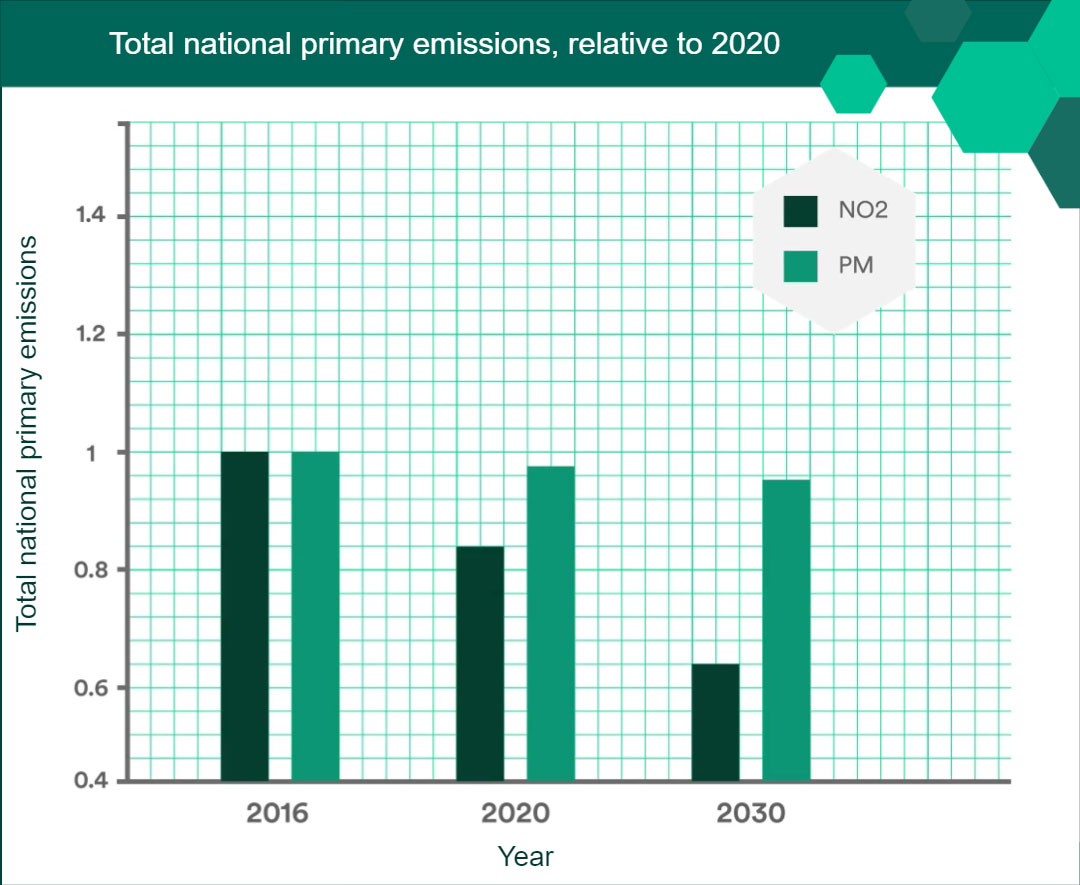
The graph shows that the total national primary emissions for NO2 and PM were level in 2016, with the projections showing NO2 emissions will reduce a lot by 2020 and significantly by 2030, whereas PM emissions are projected to reduce only marginally by 2020 and 2030.
Net zero targets and air quality
Tackling air quality and climate change are not the same, but there are clear synergies in measures that might be put in place to address them or their causes.
They are both the result of fossil fuel combustion (through transport, power generation, heating and industrial processes) as well as some agricultural activity.
Further, research is indicating a clear correlation between health impacts where both temperature and PM2.5 are raised and work is continuing to understand this in more detail through a study that will be taking place in the West Midlands, funded by the Wellcome Trust, over the next few years. What is clear is that air quality should be included in whole system approaches to tackling climate change; the WMCA-led Net Zero Neighbourhoods Programme is taking this approach as part of its delivery.
Case study
Read the case study below to learn more about improving air quality.
Improving air quality in Brockmoor through the Net Zero Neighbourhoods Programme
Brockmoor, Dudley, is set to be the first Net Zero Neighbourhood in the West Midlands.
This is part of a place-based approach being piloted by the WMCA that aims to test if a neighbourhood approach could be successful at helping to increase the scale of engagement in net zero.
Dudley MBC and partners will spend the next two years working closely with the people of Brockmoor to co-produce low-carbon and sustainability interventions to enable a Just Transition in Brockmoor.
These will include:
Extensive community engagement work, led by project partners, Keele University, to promote resident participation and collective ownership in encouraging behaviour change to improve neighbourhood air quality and related health outcomes.
The project will baseline, monitor and evaluate the impact of the Net Zero Neighbourhood on Brockmoor, and they will measure the impact of the approach on local air quality and associated changes in behaviours and travel patterns.
Section 2 | Air quality monitoring
Monitoring
Monitoring has such a key role in managing air quality as it helps determine air quality concentrations and sources of pollution which can inform planning, policy and interventions.
Some methods involve tracking specific sources and their outputs, while others involve tracking pollutants in ambient air at specific locations.
There are 1,500+ UK sites of monitoring, which comprise both automatic and non-automatic monitoring methods.
The Environment Agency manage the UK's national monitoring sites.
There are around 300 Environment Agency managed monitoring sites in total across the UK which monitor air quality, and these are organised into networks that gather a particular kind of information of different pollutants and/or sources.
An interactive monitoring map is available to view the locations of the sites in the UK networks.
Monitoring in the West Midlands
The requirement to monitor key pollutants as part of local authorities LAQM responsibilities means that many local authorities have an extensive evidence base on pollutant concentrations.
Now there is an increased focus on particulates (particularly PM2.5) the monitoring landscape is undergoing a major change from using primarily low-cost passive methods for NO2 (such as diffusion tubes which are a simple and inexpensive method for mainly measuring nitrogen dioxide), to requiring more costly PM2.5 automatic analysers and utilising low-cost sensors.
In comparison to diffusion tubes, low-cost sensors are much more expensive and require continual annual costs after purchase.
However, they do have similar drawbacks when compared to the more costly automatic monitoring - they are not as accurate. Some low-cost sensors have been awarded MCERTS standard and they can be used as a key indicative tool to understand the relative concentrations and as an engagement tool, but they are not yet able to be used for LAQM purposes or for determining compliance.
Sandwell Council’s air quality diffusion tubes, automatic monitoring stations and priority zones can be viewed in an interactive map.
Sandwell added to their monitoring network with 21 low-cost air quality monitors in six towns of Sandwell and provide real-time indicative air pollution data. Live data from 8 of these monitors can be accessed on their air quality dashboard.
Case study
Read the case study below to learn more.
Sandwell faith centre engagement
Sandwell is a superdiverse, multi-cultural and multi-faith borough, and has some of the largest and well-attended faith centres in the country.
Sandwell wants to support their faith-based organisations in leading the way towards community-driven, community-designed improvements in air quality.
This is an important issue as many ethnic minority communities become established in areas with higher levels of air pollution and as a consequence, ethnicity has become strongly correlated with increased exposure to air pollution.
As there is a significant representation of people who are Black, Asian and Minority Ethnic (BAME) within Sandwell’s faith communities, this provides the Air Quality team with a unique opportunity to work with local communities who may be experiencing particularly high levels of air pollution.
Each centre will receive a low-cost air quality monitor Zephyr for a year, located near to their centre.
The information relayed from the air quality monitor is accessed via the internet on Sandwell’s bespoke air quality dashboard. This dashboard is available for everyone to see at a glance if there are low, medium or high levels of air pollution at various locations across the six towns of Sandwell.
To assist with bringing this air quality dashboard to the attention of each faith community, a Wi-Fi enabled 43” display screen will be provided in a prominent place in the faith centre.
The dashboard can be viewed here.
The faith centres also receive a toolkit, containing information about the types of indoor and outdoor air pollution, funding and grant opportunities, information for local businesses, methods of community engagement, sustainable forms of transport, ideas for campaigns and more.
The Council’s Air Pollution Officers with support from the Public Health Development Officers, will visit the centres and encourage the faith leaders to share and use the resources provided or create their own interventions that are within the reach of their own congregations and their wider faith community.
The Sandwell Air Quality website.