Climate Adaptation Literacy Training | Module 1

Climate change in the UK and why adaptation matters

Welcome to this module on Climate change in the UK and why adaptation matters.


Introduction to the programme

This module is one of three modules within this Climate Adaptation Literacy Training Programme. You are required to complete all three modules.

Climate change in the UK and why adaptation matters

  • Headline introduction and key definitions
  • Climate change and future projections
  • Climate hazards and their potential impacts

Zooming in: Climate impacts in the West Midlands

  • Climate risks facing the West Midlands
  • Examples of climate hazards in the West Midlands

How can we adapt to climate change?

  • The measures to adapt to climate change
  • Best practice examples of climate adaptation
  • Adapting your work to be climate resilient

Once you have completed all three modules, you will get your personal certificate after the assessment at the end of the modules.


Module 1 learning outcomes

By the time you have completed this module, you should have a good understanding of:

  • The difference between climate mitigation and adaptation, and the pressing need for both.
  • The main categories of climate hazards that are experienced in the UK.
  • How climate hazards in the UK and elsewhere will produce cascading impacts.


Section 1 | Introduction to climate adaptation and key definitions

Introduction to climate adaptation

Global temperatures are rising, bringing more extreme and unpredictable weather events to the UK.

Select here to understand more about what climate adaptation is and how we are working across the WMCA to develop adaptation awareness and action.


An overview of climate adaptation

Our climate is changing. The world’s temperature is rising, bringing with it changes to the climate and to weather patterns. In the West Midlands, we are going to see:

  • Warmer, wetter winters
  • Hotter, drier summers
  • And more extreme weather events

These new weather events aren’t what we are used to in the West Midlands. Unless we adapt to and prepare for the changing climate, our people, infrastructure and natural environment will be exposed to several climate-related impacts.


An overview of climate adaptation

Climate adaptation refers to the adjustments made to ensure that our region is better prepared to react to, cope with and bounce back from climate threats.

These next three modules will guide you through why adapting to climate change is important for the West Midlands region – for the people and businesses who call the region home.

Firstly, we will start with looking into how the climate has changed and predictions of future changes.

At the national level

“The evidence of the damage from climate change has never been clearer, but the UK’s current approach to adaptation is not working.”

– Baroness Brown, Chair, Adaptation Committee

In the West Midlands

The goal of the West Midlands Combined Authority’s Climate Adaptation programme is to “ensure that the WMCA and its partners understands their climate-related risks and is taking steps to become more resilient.”

- WMCA Climate Adaptation Plan 2024

The UK Government’s vision

For the UK to be “a country that effectively plans for and is fully adapted to the changing climate, with resilience against each of the identified climate risks.”

- Third National Adaptation Programme, 2023


Key definitions

Throughout the three modules we will be using a number of key terms. You can access these at any time via the RESOURCES button.

Climate adaptation

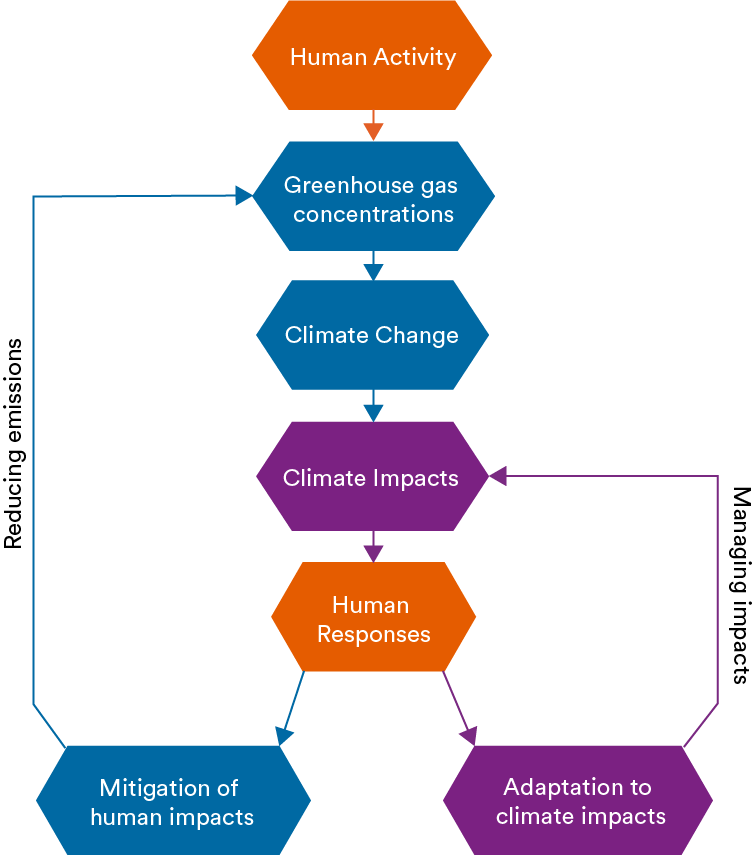
Refers to the adjustments made to ensure that we are better prepared for increasing and intensifying climate hazards.

Climate resilience

Climate resilience is the goal of adaptation, where our communities, infrastructure and natural environment can withstand, cope with, bounce back and benefit from hazardous events.

Climate mitigation

As well as adapting to climate change, we also need to prevent it. Climate mitigation refers to actions taken to prevent further climate change. This can be in the form of reducing greenhouse gas emissions or enhancing greenhouse gas ‘sinks’ such as forests or oceans which can store carbon.

Climate hazards

Climate hazards refer to the occurrence of a climate-related physical event or trend that may cause loss of life, injury or other health impacts, as well as damage and loss to property, infrastructure, livelihoods, service provision, ecosystems and environmental resources.

Climate impacts

Climate impacts refer to the effects or consequences of hazardous events on lives, livelihoods, health and wellbeing, ecosystems and species, economic, social and cultural assets, services and infrastructure.

Net zero greenhouse gas emissions

Net zero greenhouse gas emissions means that we (humans) are no longer adding to the total amount of greenhouse gas emissions in the atmosphere. It is a state of balance between the amount of carbon emitted into the atmosphere and the amount of carbon removed from it.


Key terms explained

When discussing climate impacts, RISK refers to the potential for adverse consequences of a climate-related hazard.

Risk isn’t spread evenly. VULNERABILITY refers to an individual, group or area’s predisposition to be adversely affected by climate hazards.

The risk associated with climate HAZARDS is higher when there is greater EXPOSURE: the presence of people; livelihoods; species or ecosystems; environmental functions, services and resources; infrastructure; or economic, social or cultural assets in places that could be adversely affected.


Climate change: projections

The term climate emergency has been increasingly used in recent years to describe what was previously called climate change.

The scientific consensus that humans are causing global warming has passed 99%. Studies using extensive historical data show that there has never been a period in the last 2000 years when temperature changes have been as fast and extensive as in recent decades.

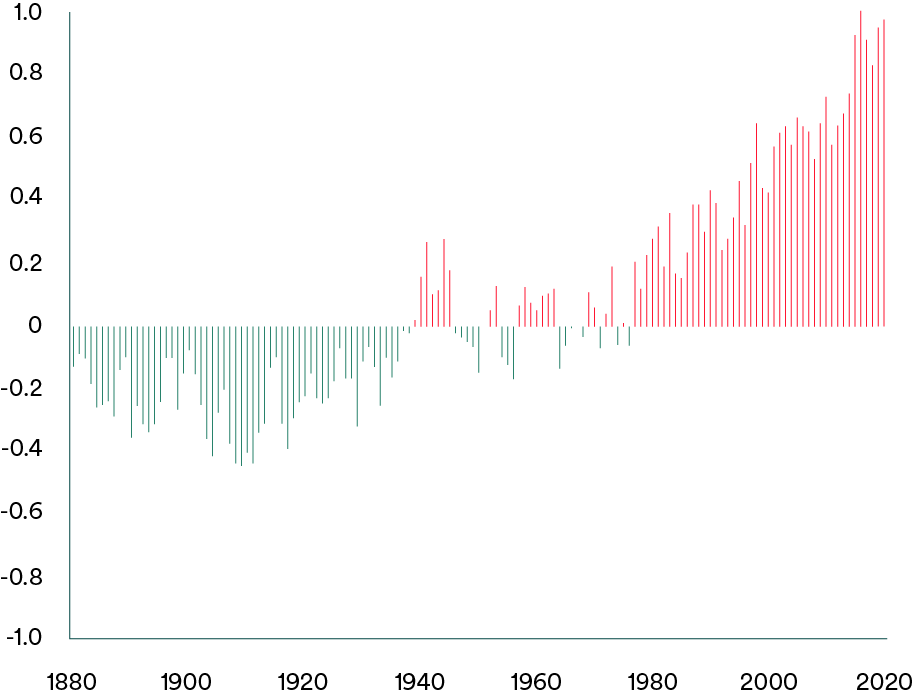
Global Average Surface Temperature

Climate change is the long-term shift in weather patterns and temperatures across the world. This shift has been conclusively caused by human activity.

The previous 10 years have been the warmest ever recorded. As of the time of writing, 22 July 2024 was the hottest day in recorded history, with an average global temperature of 17.16˚C.

This line chart shows how the average global surface temperature has rapidly increased in recent decades. Between 1880-the 1940s, average temperatures were less than the 1901-2000 baseline average. From the 1980s onwards, the average surface temperature has consistently and significantly increased, reaching a one degree in by the 2010s.

Climate change: projections

In 2015, 196 governments from across the globe agreed to a target to try and limit warming to below 1.5˚C, known as the Paris Agreement. The Agreement sets out plans to reduce greenhouse gas emissions and become more resilient to the impacts of climate change.

In late 2023, countries agreed that ‘progress was too slow across all areas of climate action’. If the global temperature exceeds 1.5˚C of warming compared to pre-industrial levels, it will irreversibly change the global climate system.

In 2024, the United Nations (UN) reported that under current action, global warming is on track to reach 3˚C by the end of the century.

Climate change targets

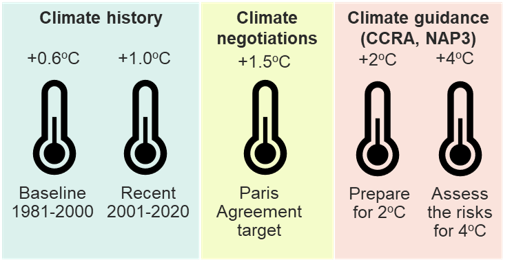
CCRA refers to the UK's national Climate Change Risk Assessment. This is published every 5 years.

NAP3 is the UK's third National Adaptation Programme which outlines the government's plans for adaptation action on a 5-year basis.

Climate History, +0.6°C: Slight increase compared to the baseline. Baseline (1981-2000): This is the starting point for comparison. +1.0°C: More noticeable increase. Recent (2001-2020): This shows the recent warming compared to the baseline. Climate Negotiations, +1.5°C: Slightly higher increase. Paris Agreement Target: Countries aim to stay below this to avoid severe climate impacts. Climate Guidance (CCRA, NAP3), +2°C: More significant warming. Prepare for 2°C: We need to prepare for this level of warming. +4°C: Much higher increase. Assess the Risks for 4°C: Consider the serious problems if the world warms this much.

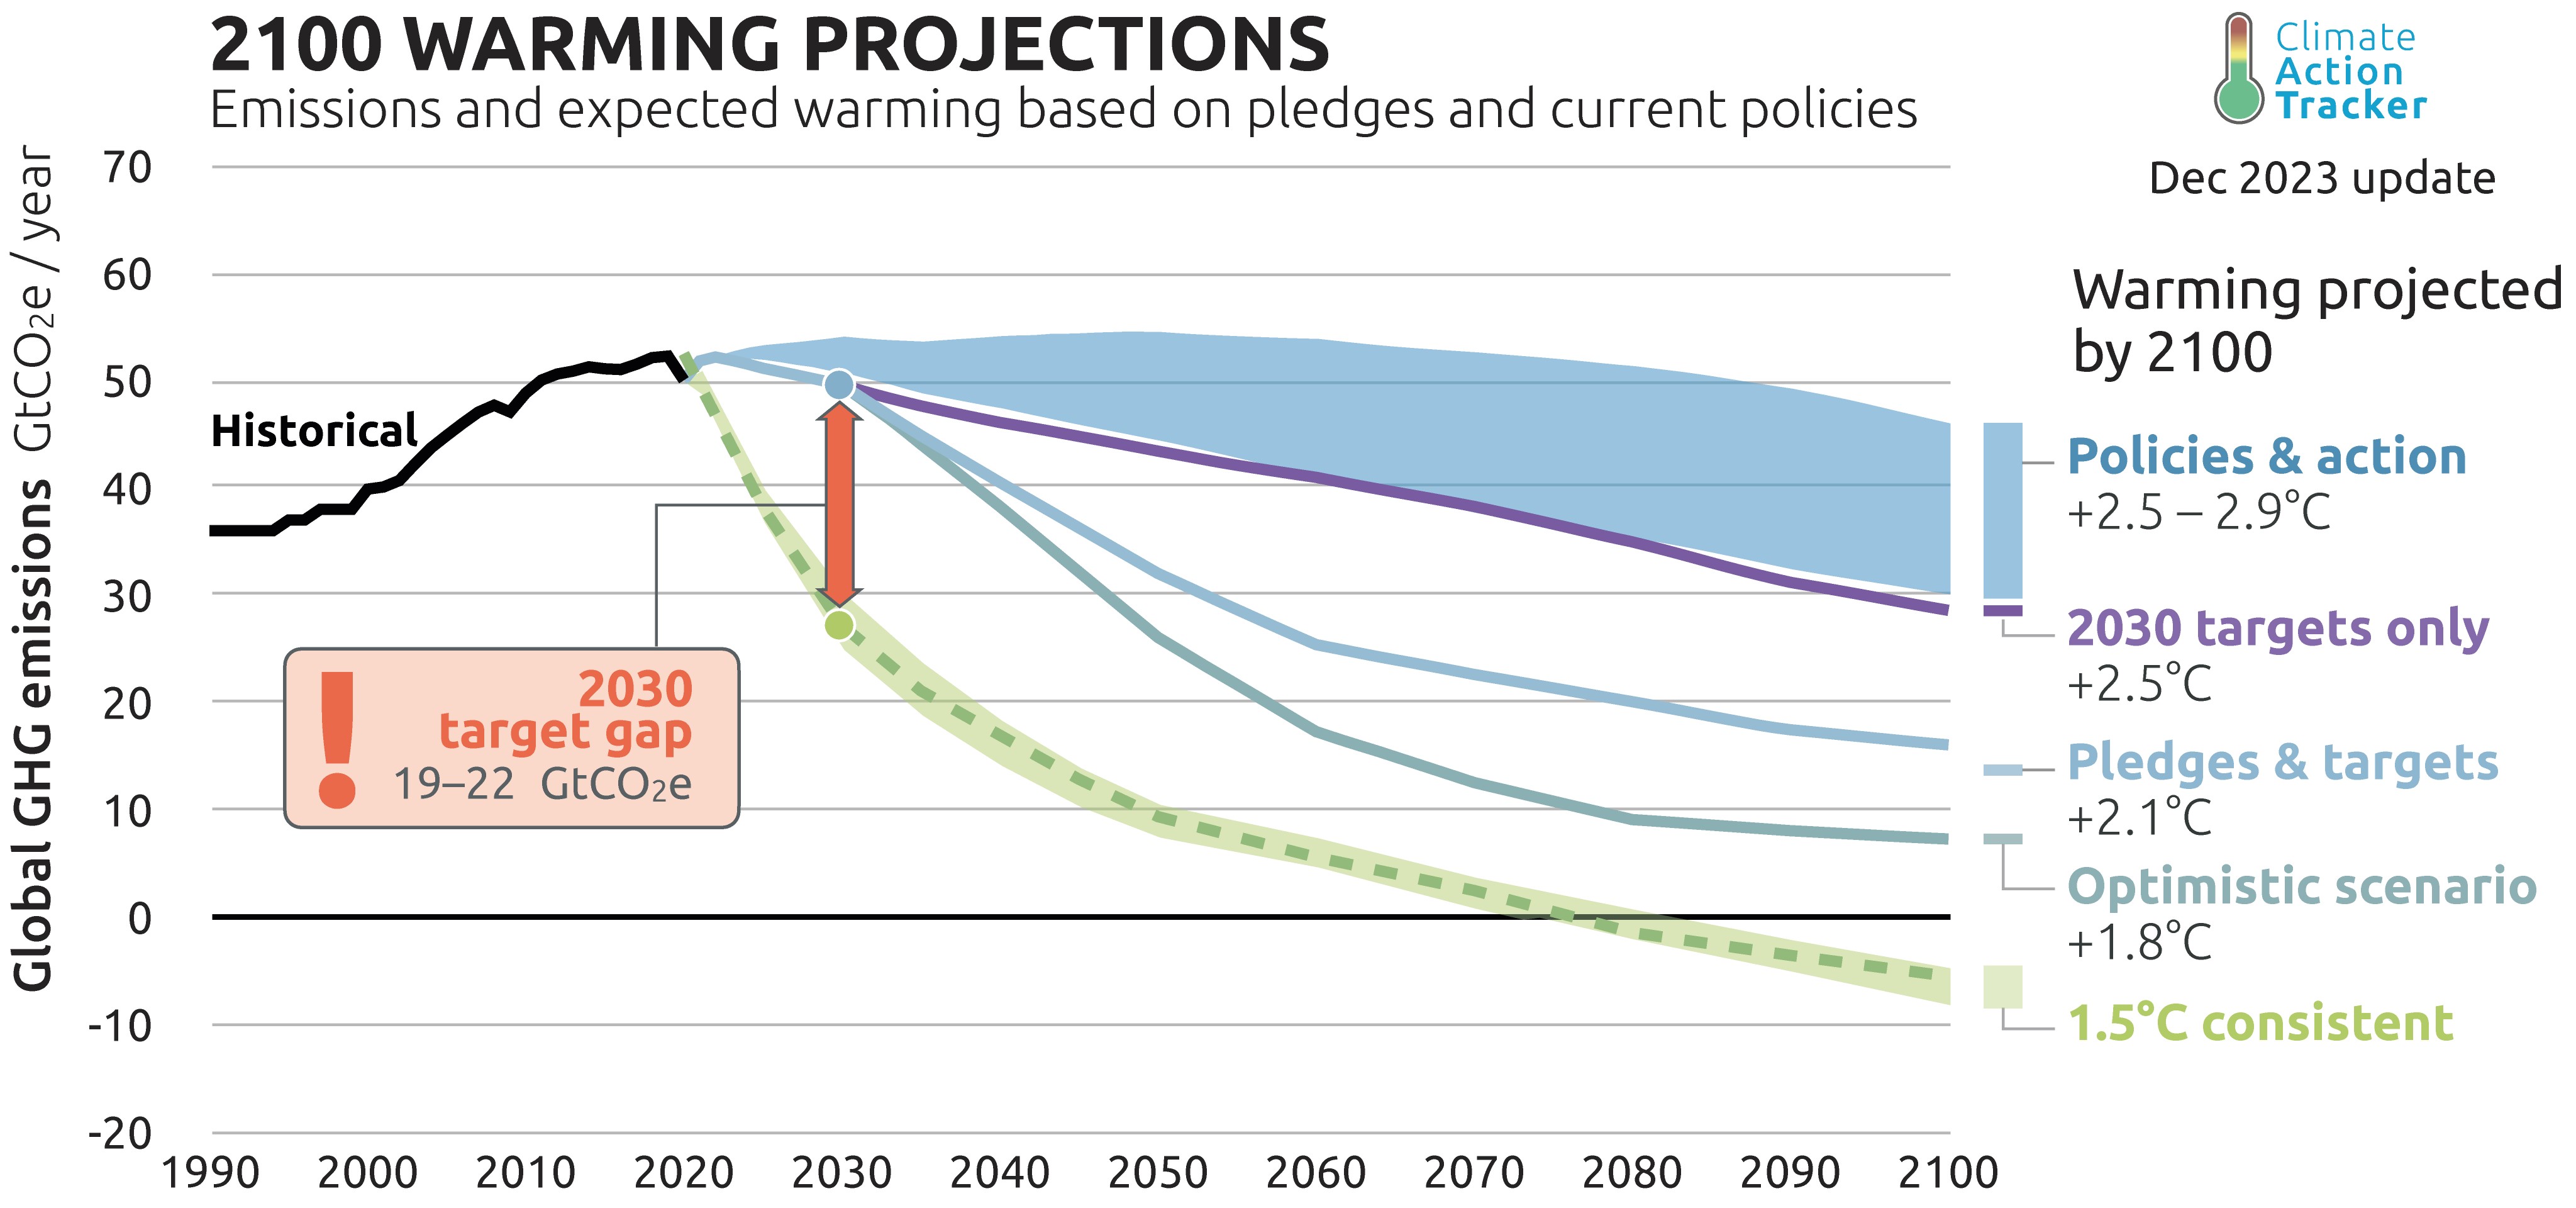
2100 Warming projections

The graph titled ‘2100 Warming Projections’ illustrates various scenarios for global greenhouse gas (GHG) emissions and their corresponding temperature increases by the year 2100. Here's a summary: Historical Data: Up to around 2020. Policies & Action (blue line): Projected to lead to a warming of +2.5 - 2.9°C. 2030 Targets Only (purple line): Projected to lead to a warming of +2.5°C. Pledges & Targets (blue line): Projected to lead to a warming of +2.1°C. Optimistic Scenario (blue-green line): Projected to lead to a warming of +1.8°C. 1.5°C Consistent Pathway (yellow-green line): Represents the pathway consistent with limiting warming to 1.5°C. Additionally, the graph highlights a ‘2030 target gap’, indicating a shortfall of 19-22 GtCO₂e in emissions reductions needed to meet the targets. This data is from the Climate Action Tracker's December 2023 update.

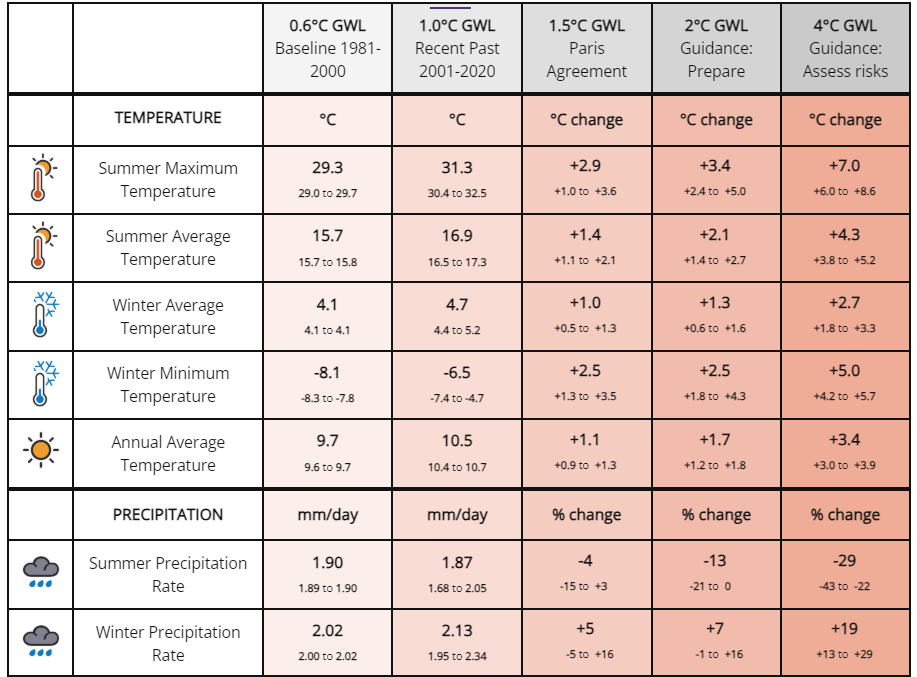
Temperature changes in the West Midlands

Global warming levels (GWL) are a simple way to represent climate change at the global scale, which then drives local changes. Changes are relative to the pre-industrial baseline (1850-1900). We have already reached +1.2°C.

Temperature changes in the West Midlands (1981-2000 baseline) Summer Maximum: Increased by +1.3°C (31.3°C) in the recent past. Projections show increases of +2.9°C (32.2°C) at 1.5°C global warming, +3.4°C (32.7°C) at 2°C, and +7.0°C (36.3°C) at 4°C. Summer Average: Increased by +1.2°C (16.9°C) in the recent past. Projections show increases of +1.4°C (17.1°C) at 1.5°C, +2.1°C (17.8°C) at 2°C, and +4.3°C (20.0°C) at 4°C. Winter Average: Increased by +0.6°C (4.7°C) in the recent past. Projections show increases of +1.0°C (5.1°C) at 1.5°C, +1.3°C (5.4°C) at 2°C, and +2.7°C (6.8°C) at 4°C. Winter Minimum: Increased by +1.5°C (-6.5°C) in the recent past. Projections show increases of +2.5°C (-5.6°C) at 1.5°C, +2.5°C (-5.6°C) at 2°C, and +5.0°C (-3.1°C) at 4°C. Annual Average: Increased by +1.0°C (10.7°C) in the recent past. Projections show increases of +1.1°C (10.8°C) at 1.5°C, +1.7°C (11.4°C) at 2°C, and +3.4°C (13.1°C) at 4°C.

Climate change: the outlook

Even if we achieved net zero greenhouse gas emissions tomorrow, existing emissions in the atmosphere would still impact the Earth’s weather patterns and overall temperature. This is because there is a lag between action and impact - past emissions are affecting us now, and present-day emissions lock in future climate change.

This demonstrates that climate mitigation (the race to reduce emissions) alone is not enough to protect the planet from climate impacts. Climate adaptation is required to increase our resilience against the unavoidable consequences of climate change.

Did you know that due to its colonial history, the UK is responsible for over 5% of cumulative greenhouse gas emissions currently in the atmosphere? Only the USA, China and Russia have contributed more.

This diagram shows the different between climate adaptation action and climate mitigation action. Climate mitigation actions aim to reduce green house gas emissions and prevent further climate change. Climate adaptation actions aim to manage the impacts of the climate change that we can’t avoid.


Knowledge check

Climate adaptation refers to the adjustments made to ensure that we are better prepared for climate hazards.

Climate resilience is the goal of climate adaptation - where our communities, infrastructure and natural environment can withstand, cope with and bounce back from climate impacts.

If we achieved net zero greenhouse gas emissions tomorrow, existing emissions in the atmosphere would still impact the Earth’s weather patterns and temperature.


Section 2 | Climate change and future projections

Remember the eighties?

Before we get started, it is worth remembering the 1980s. Madonna, Prince and U2 dominated the charts, the world was introduced to Nintendo’s Super Mario Bros, and people wore far too much neon.

More alarmingly, there was also a growing hole in the Earth’s ozone layer, threatening to expose the planet to an unmanageable amount of UV radiation from the Sun. We worked out that this was caused by chemicals used in fridges, air conditioners and aerosols at the time. Left unaddressed, this problem would have damaged our health and crippled the ecosystems that we need to sustain life on Earth.

In 1987, the UN adopted the Montreal Protocol, agreeing to phase out the production of the chemicals that were damaging the ozone layer. This later became the first treaty to be signed by every country on Earth.

By 2009, 98% of the chemicals specified in the treaty had been phased out. The ozone layer is gradually healing.

The first two modules of this course are going to be pretty bleak. We are going to confront how climate change will impact people across the West Midlands. However, with this knowledge, we can drive changes in behaviour to adapt to these changing conditions and minimise such impacts. We have done it before.

So, remember the eighties!


Climate hazards

We have seen how a certain level of climate change is inevitable. As climate hazards are a direct consequence of climate change, this means that they too are unavoidable. By 2030, the UN predicts that ‘1.5 environmental disasters are expected to occur per day worldwide’.

In the short term, we can’t change this. However, we can still choose how and when we adapt to these emerging conditions. We can reduce the severity of the impacts of climate hazards on our lives.

The rest of this module covers the four main climate hazards that we experience in the UK. These are:

  • Temperature
  • Storm weather
  • Precipitation
  • Land changes

We are also going to learn about the cascading impacts of climate hazards that occur in the UK and elsewhere.


Climate hazard and impacts: temperature

Climate change is causing a rise in average temperatures and making periods of extreme heat much more likely. This means we are going to see more:

Heat-related ill health and mortality

People with pre-existing health conditions are especially vulnerable and the young and the elderly.

Damage to our transport and energy networks

Assets, such as overhead rail lines, can fail when we experience extreme heat.

Wildfires

High temperatures and dried-out vegetation allow fires to start and spread.


Climate hazard and impacts: temperature

Climate change is also making weather patterns and extreme events more unpredictable. Though they may be less frequent and less severe, extreme cold events will still occur - potentially when we least expect it. This means we will still see:

Cold-related ill health and mortality

Older people are more at risk from heart attacks, strokes, pneumonia, depression, worsening arthritis and increased accidents at home.

Cold and icy conditions bring an increase in slips, trips and falls.

People are confined to their homes, reducing opportunities to keep active, get outside and maintain their mental health.

Homelessness prevention and support

Local authorities initiate ‘short burst’ severe weather emergency protocols (SWEP) to provide rough sleepers with shelter during severe weather events. Short cold snaps put pressure on local authorities to provide emergency shelter that might not be used by rough sleepers, as they often tell authorities that it is not worth going inside for such short periods of time.

The unpredictability of temperatures means that SWEPs might be initiated outside the typical winter/summer periods - affecting business planning.

Damage and disruption to our transport networks

Cold, ice and snow make for hazardous driving conditions and bring an increase in road accidents.

Aircraft, tram and railway providers see the icing of overhead line equipment.

Damage and disruption to our transport networks

Unpredictable cold weather can disrupt the planning and resourcing of road and pavement gritting.

People are less able and willing to use public transport and active travel during cold and icy conditions.


Case study: the 2022 heatwave

Read the case study below to learn more about climate hazards and impacts.

During the summer of 2022, the UK experienced its hottest ever temperature, 40.3˚C.

The impacts were far reaching, with 34 locations recording temperatures exceeding the country’s previous heat record of 38.7˚C in July 2019. The heat record before that was 38.5˚C in August 2003. This culminated in the Met Office issuing the UK’s first ever red health warning for extreme heat.

The impacts of this event were extremely severe. This period saw around 3,000 excess deaths (85% of which were from people aged 65 and older), the UK’s railway network come to a near standstill, and roads and runways melted in the heat. Wildfires accompanied the sizzling temperatures across the country, with the London Fire Brigade experiencing its busiest day since the Second World War.

The impacts could easily have been even worse. The high temperatures saw a surge in electricity demand that almost led to power blackouts being experienced in parts of London. This crisis was only avoided by the National Grid buying energy from Belgium at over 5000% the usual fee!

This period of extreme heat was caused by the expansion of a high-pressure system that usually sits off the coast of Spain, Portugal and North Africa. Researchers have explicitly linked this to man-made climate change.


Climate hazard and impacts: storm weather

In the UK, storms can form when warm air (often travelling north from Spain or North Africa) combines with cold air (often from the Atlantic Ocean or travelling south from the Arctic) and interacts with moisture in the air to create unstable atmospheric conditions.

Climate change is increasing the temperature of the Earth’s atmosphere and disrupting rainfall patterns, making the presence of conditions that can fuel storms more frequent. This means we can expect more:

  • Extreme rainfall and flooding (more on this later).
  • Dangerous driving conditions.
  • Damage and disruption to critical infrastructure.
  • Damage to the natural environment.

Case study: Storm Henk

Read the case study below to learn more about climate hazards and impacts.

On 2 January 2024, large swathes of England and Wales were battered by Storm Henk. There were severe impacts across the UK:

  • By 19:00 in the evening, an estimated 38,000 properties were left without power.
  • In Nottinghamshire alone, almost 70 roads were shut.
  • The railway between Coventry and Birmingham Airport was flooded.
  • An electricity failure between London Paddington and Maidenhead stations suspended rail services.
  • Overhead wires between Watford Junction and London Euston stations were damaged, causing further closures.

Like many bouts of extreme weather, Storm Henk cast a long shadow. Reflecting on the impact of Storm Henk in January 2024, Councillors in Nottinghamshire have described the storm and subsequent flooding as ‘devastating’ and stressed that their area is still very much in a ‘recovery phase’. This is underscored by testimonies from residents, with one family being unable to return to their home for six months.


Climate hazard and impacts: precipitation

Though we will see more rainfall in the winter and less in the summer, we will experience a decline in water availability overall.

Drier summers mean more:

Droughts and water shortages

Even with robust global supply chains, these events ruin crops and raise utility bills.

Heatwaves and wildfires

We have already seen how these events endanger people and damage nature.

Wetter winters mean more:

Flooded homes

This leads to higher insurance premiums and repair costs and can forcibly displace people from their homes.

Flooded infrastructure

Flooding can bring vital transport links to a halt and trigger steep maintenance bills for key infrastructure assets.

Did you know that for every degree of warming, the Earth’s atmosphere is able to hold 7% more moisture?


Case study: the January 2024 floods

Read the case study below to learn more about climate hazards and impacts.

Flooding is a persistent problem throughout the UK, with the flooding that took place in January 2024 being just one recent example.

With the soil in many areas already saturated following the arrival of Storm Henk, and therefore unable to fulfil its natural drainage function, conditions were ripe for widespread flooding to occur after heavy rainfall.

Several rivers burst their banks, with the River Trent’s levels reaching their highest in 24 years.

In total, around 2,200 homes were flooded, as well as railway lines in south-west England.


Climate hazard and impacts: land changes

With the relationship between Storm Henk and the January 2024 floods, we have already seen how the arrival of one climate hazard can easily trigger another. This is illustrated further by how climate hazards leave enduring impacts on our landscapes. As climate change causes other climate hazards to ramp up, this means that we are going to see more:

Landslides and sink holes

Extreme weather, intense rainfall, temperature fluctuations and changes in land use are all factors that can destabilise slopes and land, leading to landslides and sinkholes.

Subsidence and heave

Extreme fluctuations between wet and dry periods can cause soils to shrink and expand in ways that can cause significant damage to buildings and infrastructure. It is estimated that 10% of British homes will suffer from subsidence by 2070.

Soil erosion

Heavy rainfall can dislodge soil particles and sweep them away through runoff, whereas droughts and extreme heat can dry soil out and prevent the growth of vegetation, leaving it increasingly exposed to damage.

Soil holds three times more carbon than our atmosphere, meaning soil erosion is likely to accelerate climate change.

With over three billion people already suffering from degraded soils, further soil erosion threatens our species’ ability to feed itself.


Climate hazards summary

The text below shows examples of how climate hazards can impact different parts of the urban landscape. The impacts are indicated by the icons in the clickable circles - the impacts range from disruption to traffic and transport, through to the damage of properties and nature and the health of people.

Extreme temperatures can cripple our towns and cities with water and energy shortages.

Climate hazards make our roads deadlier, with storms and extreme precipitation often contributing to traffic collisions.

Extreme temperatures can cause transport systems to fail, with overhead lines buckling and roads melting.

Extreme heat is responsible for a rise in respiratory conditions, heat stress and, ultimately, heat-related mortality.

If buildings aren’t properly insulated and ventilated, extreme temperatures can cause them to overheat.

Extreme weather can exacerbate poor air quality, putting public health in jeopardy.

Weather patterns are becoming more unpredictable with cold snaps and snow occurring when we least expect it.

Flooding caused by storms and increased precipitation can bring financial ruin to the residents and business owners impacted by it, alongside sustained trauma.

Both high precipitation and storms can cause chaos for our transport systems by flooding our networks, or blocking them with debris.

High wind speeds can lead to trees falling down, causing casualties and disruptions. High winds also damage overhead lines and disrupt power supplies.

Wildfires, droughts, flooding and storm-related damage are all devastating for our natural environment and local wildlife.


Knowledge check

According to the United Nations, 1.5 environmental disasters will occur every day by 2030.

For every degree of warming, the Earth’s atmosphere is able to hold 7% more moisture.

In the UK, climate change means that we are going to see hotter, drier summers and warmer, wetter winters.


Section 3 | Climate hazards and their potential impacts

Cascading impacts

So far, we have looked at several climate hazards and seen the devastating direct impacts they can have on people’s lives.

We have also seen how climate hazards can produce conditions that make further hazards more likely. Recall how both droughts and extreme rainfall can leave soil particles vulnerable to erosion, increasing the risk of destructive land changes.

To fully grasp the risks we face, and begin to do something about them, we need to understand how damaging one part of a system can have far-reaching consequences.

The following slides will introduce a few ways we can consider the impacts of climate hazards with more clarity.


Case study: “Literally in meltdown”

Read the case study below to learn more about climate hazards and impacts.

Guy’s and St Thomas’ Hospitals and the 2022 heatwave:

We have seen the impacts of the 2022 heatwave, including the health issues and heat-related mortality brought about by the soaring temperatures.

For Guy’s and St Thomas’ NHS Foundation Trust in London, one problem led to another as the 40˚C temperatures caused the Trust’s IT system to collapse.

This forced healthcare workers to revert to paper notes, generating administrative chaos, and forcing the cancellations of some operations, blood tests, cancer screenings and other appointments.

Patients affected by these failures reported that it was damaging their mental health. Some patients faced delays in receiving the results of cancer treatment and more may have been subject to delays for time-sensitive diagnoses.

The direct risks that climate hazards pose to our health are critical to understand. This case study demonstrates that an accurate picture of climate risk can’t be reached without considering the interdependencies between different areas - in this case, health and digital infrastructure.


Cascading impacts of climate change

Just as climate hazards in one area can impact multiple sectors, events in one part of the globe can rapidly spill out across the rest of the planet. The soaring prices of olive oil in British shops is a pertinent example of this following droughts and poor harvests across Southern Europe.

As climate change continues, these impacts will escalate. For example:

By 2050, the number of climate refugees is expected to surge

Estimates range from a few hundred million to upwards of a billion people.

According to the Intergovernmental Panel on Climate Change (IPCC), approximately 3.3 to 3.6 billion people live in areas that are highly vulnerable to climate change.

For comparison, the Syrian Civil War, the catalyst for the 2015 refugee crisis, externally displaced around 5 million people.

Supply chain disruption will continue to inflate prices and impact production

For example, in summer 2024, flooding in Switzerland wiped out an aluminium factory, disrupting the supply chain underpinning several car companies, including Jaguar Land Rover, one of the West Midlands’ largest employers.

The impact can be seen in UK supermarkets too, with the price of olive oil rising exponentially in 2023 and 2024 due to consistent droughts in Spain that have significantly impacted yields.

Disease-carrying mosquitos will expand their habitats

Rising temperatures will enable mosquitos to spread beyond their current habitats, bringing diseases like malaria and dengue fever with them and putting billions more of us in harm’s way.


Climate hazards and inequality

The previous slides have already shown us how climate hazards are experienced unequally.

View the two maps and then select here to visit an interactive map to help convey how different countries fit into the climate change picture - both the causes and the risks. (This link will open a new window.)

Country sizes show the wealth of each nation

This map of the globe has resized each country to represent the scale of wealth belonging to each nation.

Country sizes show the people at risk of climate change

This map of the globe has resized each country to represent the scale of risk facing each nation due to climate change. This contrasts with the previous version of the map as the poorest countries face the greatest level of climate risk.

Climate hazards and inequality

For people with pre-existing health conditions, the collapse of Guy’s and St Thomas’ Hospitals’ IT system was an inherently bigger issue. Additionally, the existence of climate refugees explicitly demonstrates that some areas of the planet are currently experiencing the impacts of climate change more severely than others.

There are countless other factors that exacerbate people’s experiences of climate hazards. The better we can understand these factors, the more effectively we will be able to respond to climate hazards.

We will explore these factors, and how they relate to the experience of climate hazards in the West Midlands, further in the next module.


Britain leads the world…

We have already seen how the UK is the fourth highest historical contributor to the cumulative greenhouse gas emissions that are currently in our atmosphere.

Unfortunately, we are also world leaders in another area: destroying our natural environment. Due to industrialisation, intensive land exploitation and climate change, we have already destroyed more than half of our natural biodiversity.

41% of species have declined in the UK since the 1970s alone. To put this into perspective, this means that over 40 million birds have disappeared from our skies in the last 50 years. What will the next 50 look like?

We can’t survive without biodiversity. From fresh water, food and fuel supplies, to medical research, to our mental health, biodiversity underpins every aspect of our lives.

We can begin to turn back the tide of biodiversity loss by prioritising nature recovery through protecting current habitats and creating new ones.

It is important to stress that the biodiversity crisis and the climate crisis are separate but interlinked issues. Some of the solutions that we can adopt can help us to tackle both, such as utilising nature-based solutions when adapting to climate hazards (we will learn more about these in Module 3).


Summary

You have now completed this module on climate change in the UK and why adaptation matters.

To recap, we have learned:

  • Climate change is already happening, and we are going to see an increase in climate hazards.
  • The key climate hazards experienced in the UK will be changes in temperature, extreme weather, precipitation and land changes.
  • We will also experience the cascading impacts of climate hazards globally, through factors such as mass displacement and supply chain disruption.
  • It is not all doom and gloom. We have made transformative changes to protect ourselves before, and we are capable of doing so again.

You may now close out of the module or browse the RESOURSES below.


RESOURCES