GLOSSARY
A
Active heating/cooling
The use of mechanical technology and therefore energy to keep spaces at the right temperature. Depending on the energy source, active heating and cooling can have counteractive effects on net zero ambitions.
Adaptive capacity
The ability of systems, institutions, humans and other organisms to adjust to the potential consequences and to take advantage of opportunities of climate change.
Air Quality Action Plan (AQAP)
For each Air Quality Management Area (AQMA) the local authority is required to draw up an Air Quality Action Plan (AQAP) to secure improvements in air quality and show how it intends to work towards achieving air quality standards in the future.
Air Quality Management Area (AQMA)
A designated area in the United Kingdom where air quality objectives and standards for specific air pollutants are not being met or are at risk of not being met. Local authorities declare AQMAs to address and manage air quality issues in certain locations. The primary purpose of designating an AQMA is to take targeted actions to improve air quality within that specific area.
Ambient air quality
The quality of the air in the outdoor environment.
Ammonia (NH3)
A gas emitted from primarily agriculture, that can play a major role in secondary particulate matter formation and have an impact on ecological receptors.
Annual Status Report (ASR)
A document that provides an overview of air quality in a specific area, typically at the local authority level. Local authorities are responsible for monitoring and assessing air quality within their jurisdictions, and the ASR is a key component of the Local Air Quality Management process.
AQ-LAT
A tool developed by WM-Air to estimate the future health and healthcare costs and benefits associated with changes in fine particulate matter and nitrogen dioxide concentrations in the WMCA area.
Automatic air quality monitor
A device or system designed to continuously and automatically measure and record various air quality parameters in the ambient environment. Typically, these are of 'reference' or 'reference equivalent' standard and can provide the most accurate monitoring data when properly calibrated and maintained.
C
Clean Air Zone (CAZ)
An area where specific measures and regulations are put in place to improve air quality by reducing air pollution. The primary objective of a CAZ is to limit the impact of harmful air pollutants, particularly in areas where pollution levels exceed established legal limits. There are a range of classes from A to D, where Class A enforces the least restrictions and Class D enforces the most restrictions on vehicle types. The Birmingham CAZ is a Class D.
Climate adaptation
The adjustments made to ensure that we are better prepared for increasing and intensifying climate hazards.
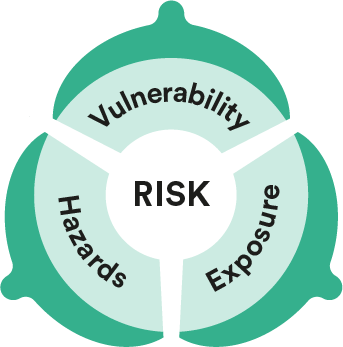
Climate exposure
The presence of people, livelihoods, species or ecosystems; environmental functions, services and resources; infrastructure; or economic, social or cultural assets in places that could be adversely affected by climate hazards.
Climate hazards
The occurrence of climate-related physical events or trends that may cause loss of life, injury or other health impacts, as well as damage and loss to property, infrastructure, livelihoods, service provision, ecosystems and environmental resources.
Climate impacts
The effects or consequences of hazardous events on lives, livelihoods, health and wellbeing, ecosystems and species, economic, social and cultural assets, services and infrastructure.
Climate mitigation
The actions taken to prevent further climate change. This can be in the form of reducing greenhouse gas emissions or enhancing greenhouse gas ‘sinks’ such as forests or oceans which can store carbon.
Climate resilience
The goal of adaptation, where our communities, infrastructure and natural environment can withstand, cope with, bounce back and benefit from hazardous events.
Climate risk
Refers to the potential for adverse consequences of a climate-related hazard.
Climate vulnerability
Refers to an individual, group or area's predisposition to be adversely affected by climate hazards.
Constituent local authorities
WMCA member local authorities with full voting rights. This is comprised of Birmingham City Council, City of Wolverhampton Council, Coventry City Council, Dudley Metropolitan Borough Council, Sandwell Metropolitan Borough Council, Solihull Metropolitan Borough Council and Walsall Metropolitan Borough Council.
D
Defra
Department for Environment, Food and Rural Affairs
DLUHC
Department for Levelling Up, Housing and Communities
Domestic combustion
Primarily the burning of solid fuels in homes for heating and cooking purposes. It typically involves the use of open fires, wood-burning stoves, coal fires and other forms of solid fuel heating and cooking appliances within residential properties. The combustion of solid fuels in households can be a significant source of air pollution, particularly in areas with a high prevalence of such practices. It also includes the use of gas appliances for cooking and heating.
E
EV
Electric vehicle
F
FDG
Framework Delivery Group
Fraction of mortality attributable to particulate air pollution
A metric used to estimate the proportion of premature deaths within a population that can be attributed to exposure to particulate air pollution.
G
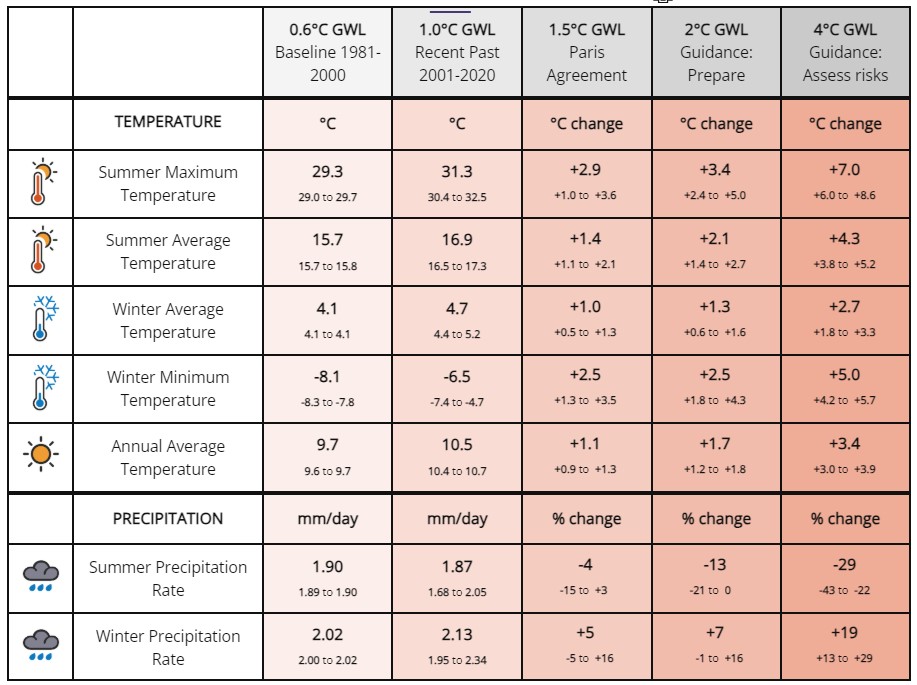
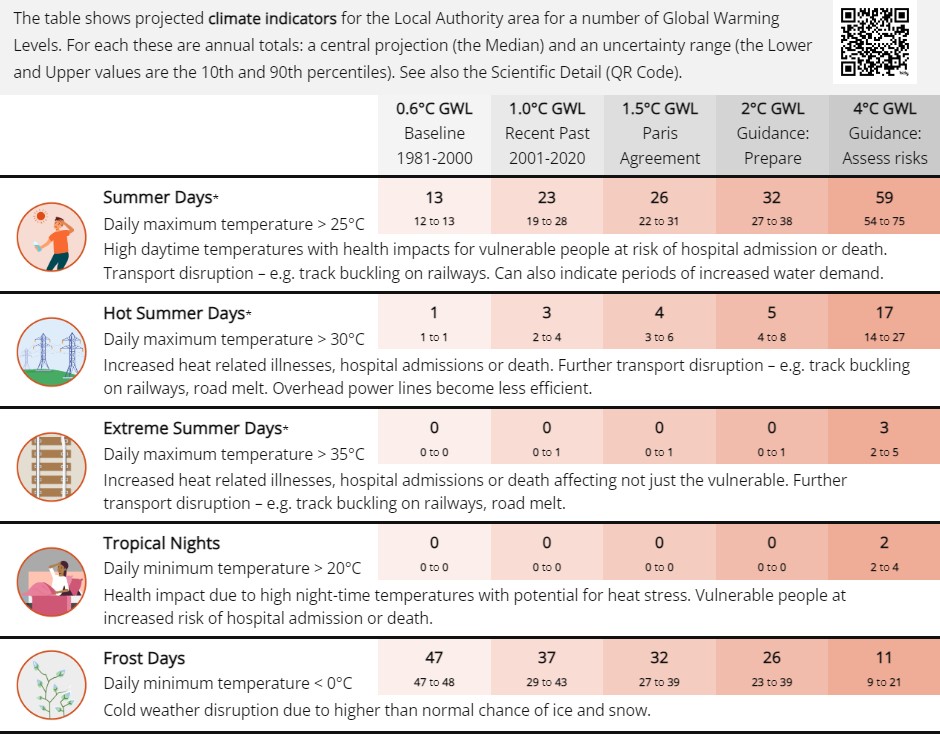
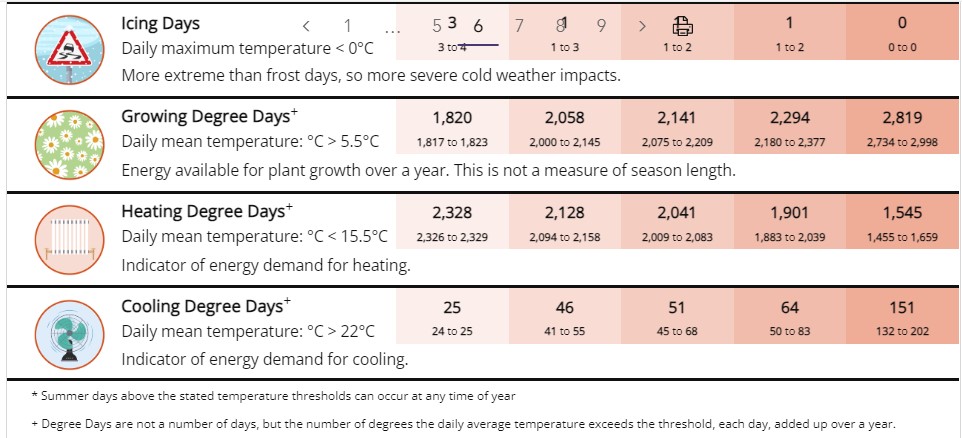
Global warming levels (GWL)
A simple way to represent climate change at the global scale, which then drives local changes. Changes are relative to the pre-industrial baseline (1850-1900). We have already reached +1.2°C.
Greener Together Citizens’ Panel
A group of 30 citizens of the West Midlands who are participating in a panel to deliberate on some of the climate and environmental issues facing the West Midlands. More information on the panel, and the selection process, can be found here: Greener Together Citizens’ Panel.(wmca.org.uk)
Guiding principles
A set of considerations proposed by the WMCA Greener Together Citizens’ Panel that should be used as part of the detailed assessment and implementation of Framework options, work packages and measures.
H
Heave
A sideways displacement of an area of land.
HGV/HDV
Heavy goods vehicles/heavy duty vehicles
I
ICE
Internal combustion engine
Impacts
The effects of climate hazards on lives, livelihoods, health and wellbeing, ecosystems and species, economic, social and cultural assets, services, and infrastructure.
Indoor air quality
The condition of the air within indoor spaces, such as homes, offices, schools and other enclosed environments. It encompasses the presence and concentration of various pollutants and contaminants in the indoor air and their potential impact on the health, comfort and wellbeing of occupants. Maintaining good indoor air quality is essential for creating a healthy and comfortable indoor environment.
Interdependency
An interdependency is the condition where two or more systems depend on each other to function properly. If one system fails in some way, it will have a cascading impact on its dependent system(s).
L
LA
Local authority
LVD
Light duty vehicles
LEZ
Low Emission Zone
Local Air Quality Management (LAQM)
A framework established under the Environment Act 1995 to assess and manage air quality at the local level. It is designed to monitor and improve air quality in areas where pollution levels may be a concern.
Low-cost sensor
A relatively affordable device designed to measure and monitor various air pollutants in the surrounding environment. These sensors are intended for widespread deployment, enabling individuals, communities and organisations to access real-time or near-real-time data on air quality. While they may not provide the same level of accuracy as certified monitoring equipment, they serve as valuable tools for raising awareness about local air quality issues and for promoting citizen engagement in environmental monitoring efforts.
LTP
Local transport plan
M
MCERTS/iMCERTS
MCERTS is the Environment Agency’s Monitoring Certification Scheme for equipment, personnel and organisations. iMCERTS is sometimes used to indicate equipment that conforms to the performance standard for indicative ambient particulate monitors.
Micrometres (μm)
Example sentence: PM2.5 - particulates that are less than 2.5 micrometres (μm) in diameter.
N
National Atmospheric Emissions Inventory (NAEI)
Estimates of the annual pollutant emissions within the UK, based on a range of data sources.
Nature-based solutions
An umbrella term covering a huge range of climate adaptation interventions that can help us improve drainage capacity, combat air pollution, reduce air and surface temperatures and improve biodiversity.
Net zero
Refers to the balance between the amount of greenhouse gases emitted into the atmosphere and the amount removed from the atmosphere. Achieving net zero means that the total emissions of greenhouse gases are equal to the total removal of these gases from the atmosphere, effectively resulting in no additional increase in the concentration of greenhouse gases. This balance is crucial in the fight against climate change, as it aims to limit global warming to well below 2°C above pre-industrial levels, in line with the goals of the Paris Agreement.
Net zero greenhouse gas emissions
When we (humans) are no longer adding to the total amount of greenhouse gas emissions in the atmosphere. It is a state of balance between the amount of carbon emitted into the atmosphere and the amount of carbon removed from it.
Nitrogen dioxide (NO2)
A gaseous component of air pollution and is often produced by the combustion of fossil fuels, such as in car engines and power plants.
Nitrogen oxides (NOx)
A collective term used to refer to a group of reactive nitrogen oxide, primarily nitric oxide (NO) and nitrogen dioxide (NO2).
P
Particulate matter (PM)
A complex mixture of tiny solid particles and liquid droplets suspended in the air. These particles vary in size, composition and origin and can have significant effects on air quality, human health and the environment.
Passive heating/cooling
The use of non-mechanical technology, design elements and nature-based solutions to keep spaces at the right temperature without using energy.
PM10
Particulate matter with an aerodynamic diameter of less than 10 micrometres.
PM2.5
Particulate matter with an aerodynamic diameter of less than 2.5 micrometres. Also known as fine particulate matter.
Primary pollutants
Pollutants that are emitted directly into the atmosphere because of human activities or natural processes. These pollutants are released in their original form and are not the result of chemical reactions in the atmosphere. An example of a primary pollutant are gases, such as NO2, produced during combustion.
S
Secondary pollutants
Pollutants that are not emitted directly into the atmosphere but are formed in the atmosphere through chemical reactions involving primary pollutants, atmospheric constituents (like sunlight, water vapour and oxygen) and sometimes natural sources. An example of this is secondary particulate matter that is formed from ammonia due to reactions in the air.
Smoke Control Zone (SCZ)
A designated area where you cannot release smoke from a chimney; and you can only burn authorised fuel, unless you use an appliance approved by Defra. There are also penalties that can be applied if your chimney releases smoke in a smoke control area or if you buy unauthorised fuel to use in an appliance that’s not approved by Defra.
Sustainable drainage systems (SuDS)
Measures used to manage stormwater through infiltration, attenuation and passive treatment. Some SuDS may involve hard engineering, but those that are nature-based, aim to mimic natural water processes using vegetation, with a focus on achieving biodiversity and amenity benefits in addition to the traditional SuDS benefits of dealing with water quantity and quality.
T
Thermal comfort
The condition of mind which expresses satisfaction with the thermal environment. (BS EN ISO 7730) - which means the condition of not feeling too hot nor too cold.
Transport for West Midlands (TfWM)
The public body responsible for co-ordinating transport services within the WMCA area.
U
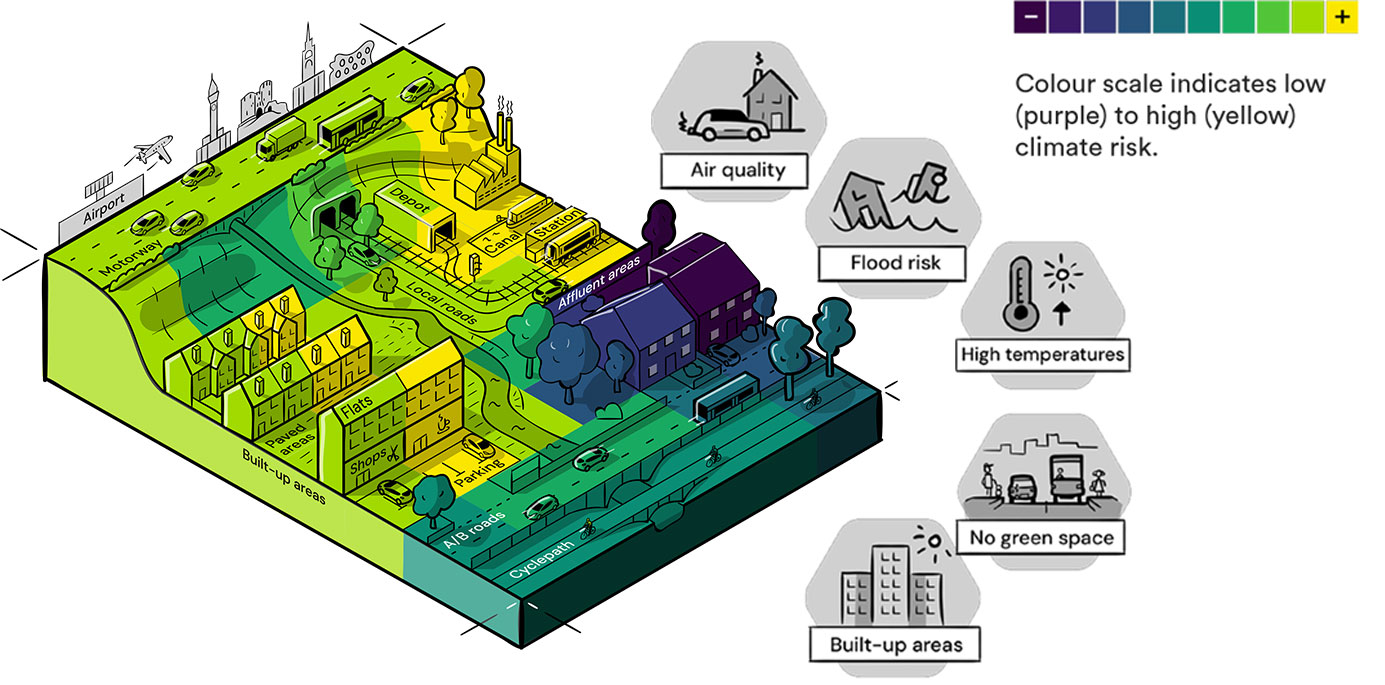
Urban heat island effect
An urban heat island, or UHI, is a metropolitan area that is a lot warmer than the rural areas surrounding it. Heat is created by energy from all the people, cars, buses and trains in big cities like New York, Paris and London. This energy is absorbed by the fabric of the built environment which re-radiates the heat afterwards, amplifying the temperature compared to the rural surroundings. UHIs are created in places that have lots of activity, lots of people and an urbanised built environment.
V
VOCs
Volatile Organic Compounds
W
WC
Walsall Council
World Health Organisation (WHO)
A specialised agency of the United Nations responsible for international public health.
WM-Air
The West Midlands Air Quality Improvement Programme – WM-Air is a NERC-funded initiative, led by the University of Birmingham.
West Midlands Combined Authority (WMCA)
The WMCA is a regional governing body and partnership in the United Kingdom, established to promote economic growth, infrastructure development and improved public services in the West Midlands region. It was created as part of the government's devolution agenda to empower regions and cities in England with greater decision-making powers and control over local issues. It was established by statutory instrument under the Local Democracy, Economic Development and Construction Act 2009.